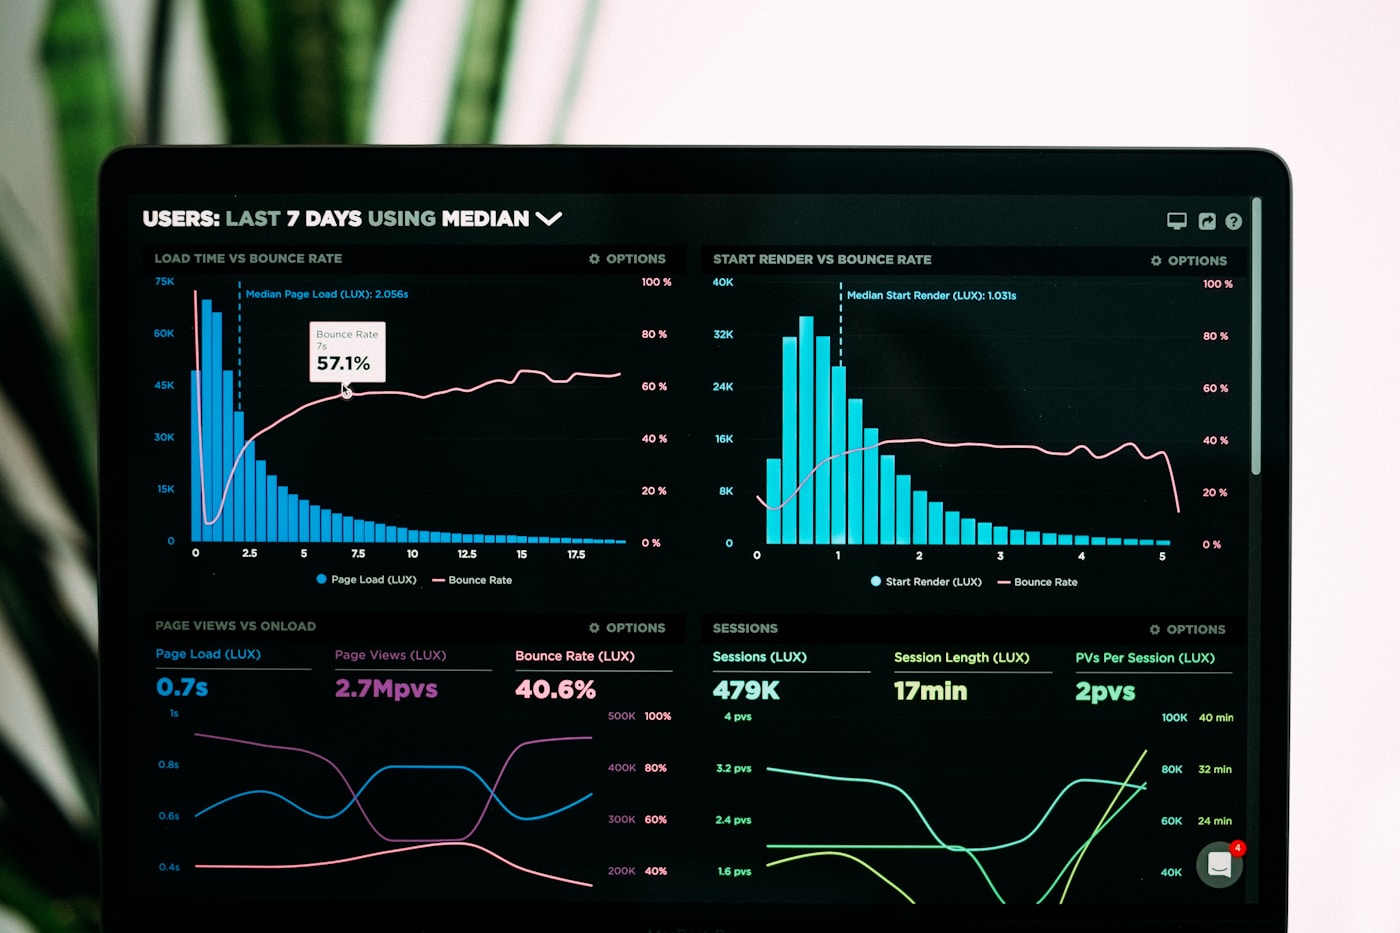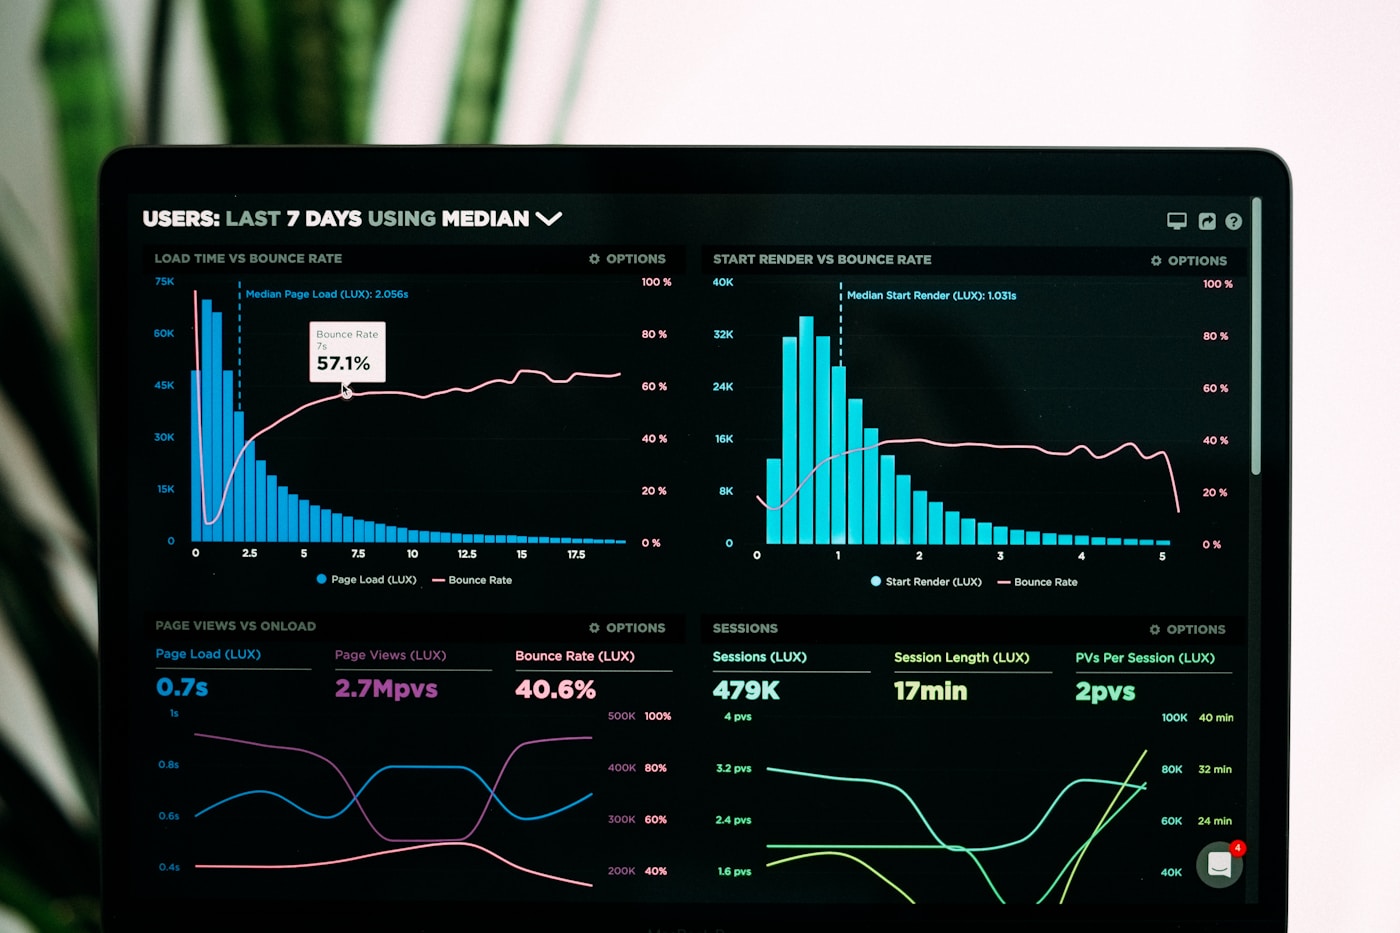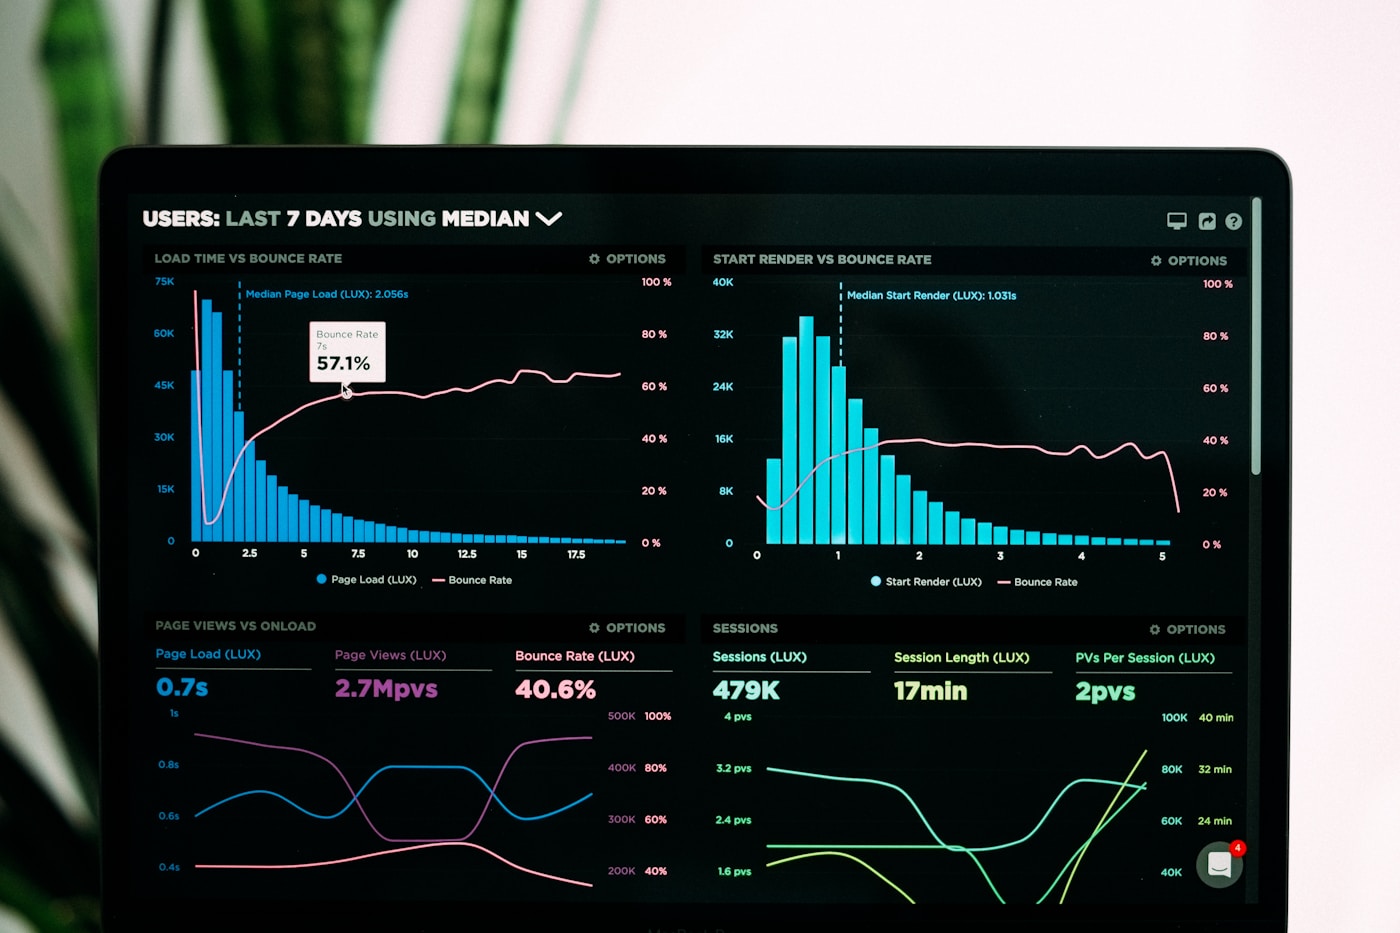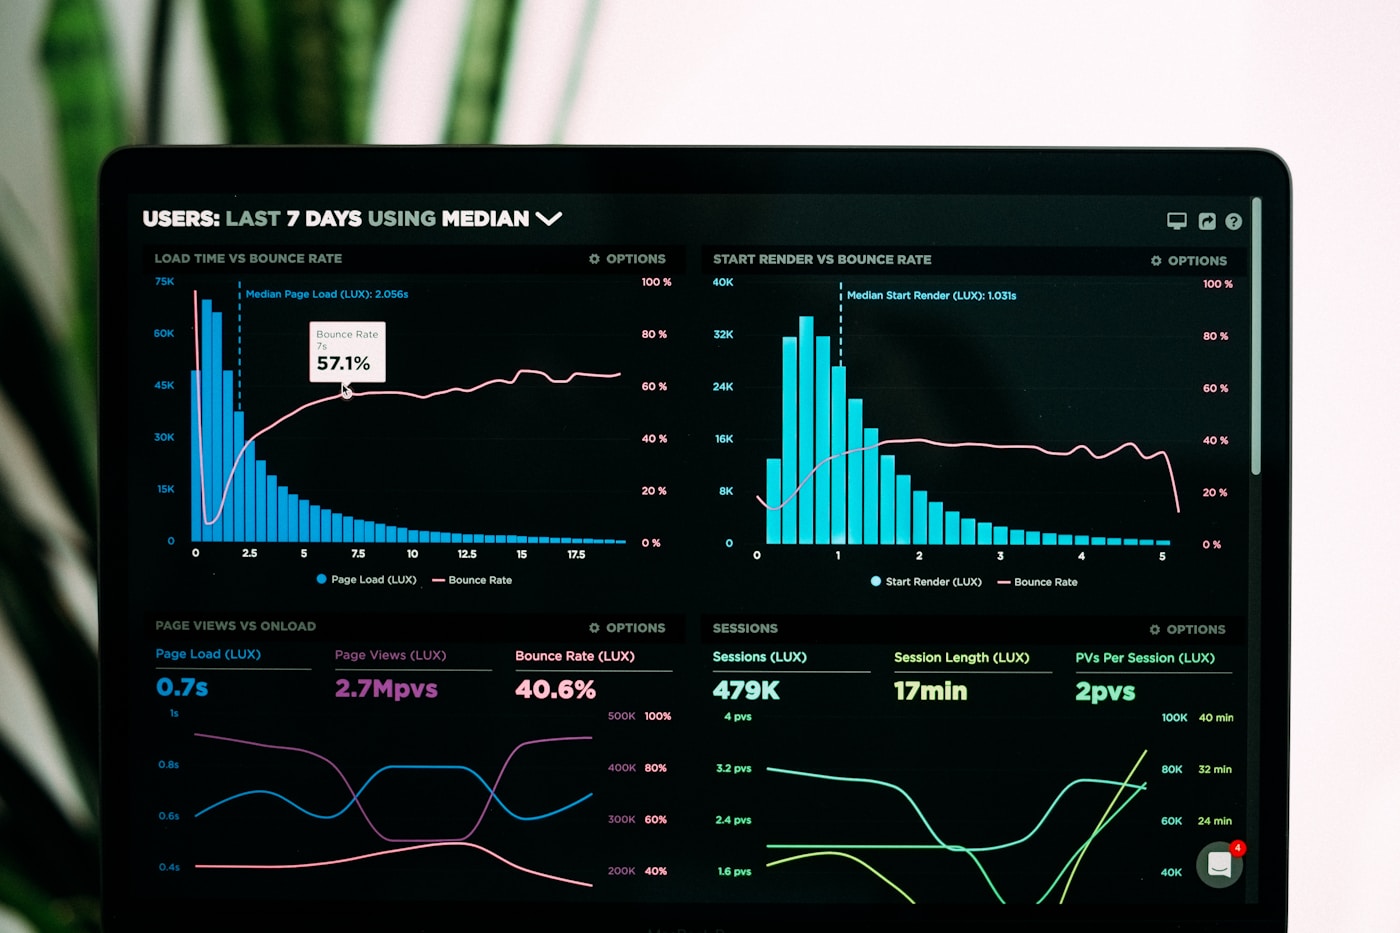
A Tunis startup with one or two production services does not need a five-figure observability contract on day one. Prometheus collects time-series metrics, Grafana visualizes them, and Alertmanager routes pages—three open source components that fit comfortably on a single VPS alongside your app. Add Grafana Loki only when log search becomes a weekly debugging habit, not because a vendor slide deck says you need the full three pillars immediately.
DarDev runs this on dardev-vps: node metrics, deploy-tied dashboards, and alerts on error-rate spikes—not every CPU blip.
Minimum stack: Prometheus and Grafana
- Prometheus scrapes /metrics endpoints and stores samples locally with configurable retention
- node_exporter exposes CPU, memory, disk, and network on the VPS host
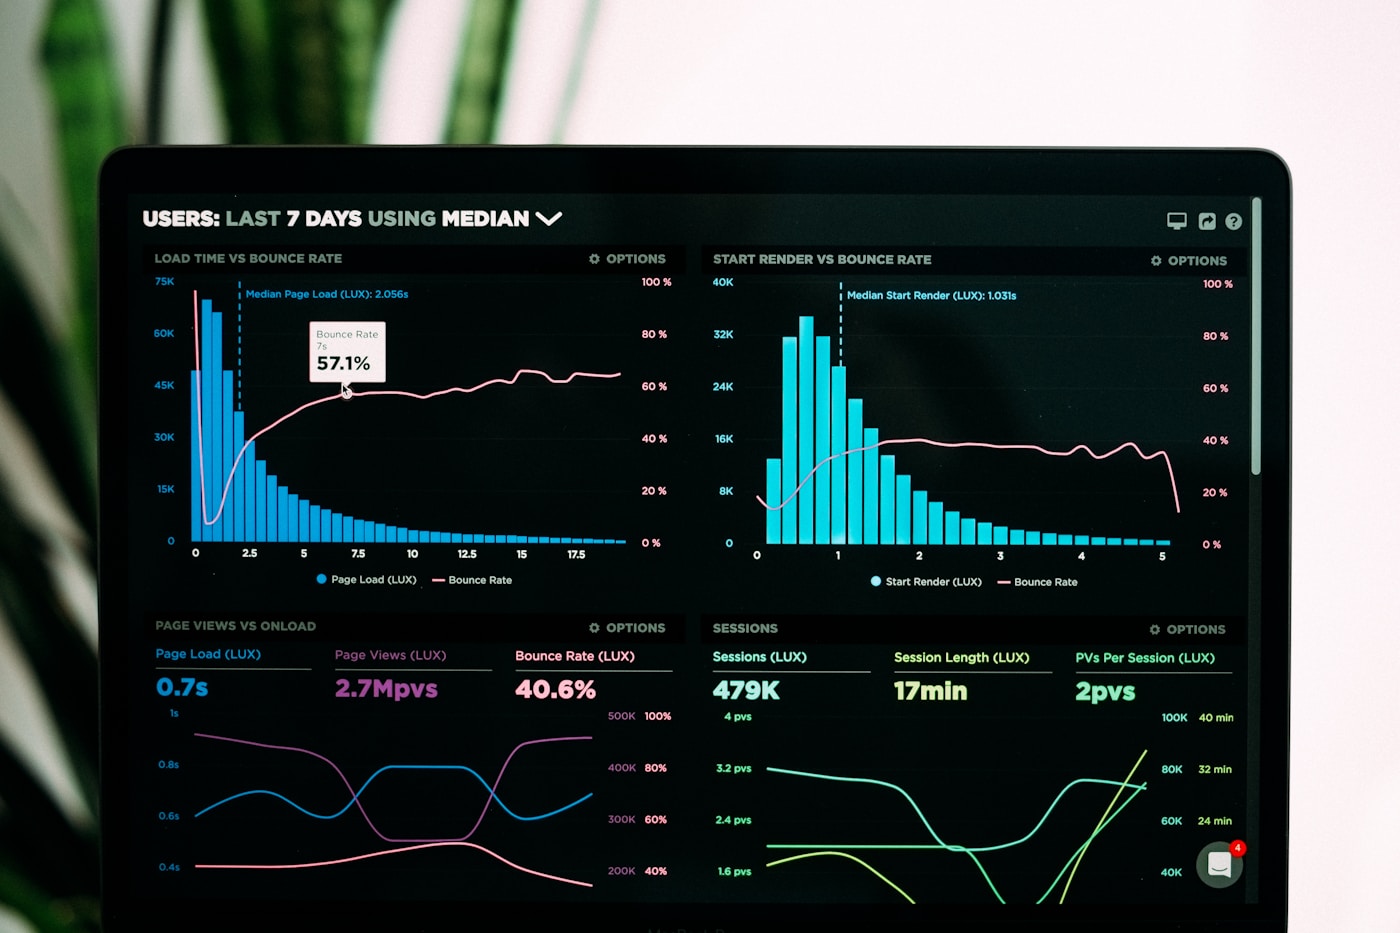
- Grafana queries Prometheus and renders dashboards your on-call actually opens during incidents
- Alertmanager groups alerts, applies silences, and forwards to Slack, email, or Telegram
- Your app exports HTTP request counts, latency histograms, and dependency health gauges
That answers what Tunis engineering leads ask first: Is the API up? Are 5xx errors climbing? Did disk fill overnight? Metrics at fifteen-second scrape intervals stay cheap for a handful of targets—no per-host or per-gigabyte SaaS billing. Before instrumenting everything, see logs vs metrics vs traces: when to use what; most seed-stage teams ship a monolith where metrics plus structured logs cover ninety percent of incidents.
Single VPS layout
- Pick a VPS with headroom
An OVH or comparable 4 vCPU / 8 GB RAM instance handles Prometheus, Grafana, Alertmanager, node_exporter, and a modest Loki install for early-stage traffic. Leave thirty percent RAM free for spikes.
- Deploy with Compose or systemd
Docker Compose is fine for teams without Kubernetes yet. Pin image versions, mount persistent volumes for Prometheus TSDB and Grafana DB, and expose Grafana only behind TLS on a subdomain.
- Scrape app and host
Add prometheus.yml targets for localhost:9100 (node_exporter) and your app /metrics port. Use basic auth or network policy so metrics endpoints are not public internet.
- Import starter dashboards
Grafana dashboards for small platform teams lists panel patterns we reuse: CPU, memory, HTTP error rate, and deploy annotations. Customize thresholds to your SLOs, not vendor defaults.
- Define three alerts
Start with target down, error rate above baseline, and disk eighty-five percent full. Fewer alerts that wake someone beat fifty muted rules.
Co-locating observability with a lightweight API works for single-region setups. Split to a dedicated instance once revenue covers it or workloads risk OOM during incidents.
When to add Loki (optional)
Loki indexes labels—not full text at ingest—so grep-by-service stays cheaper than Elasticsearch. Add it when engineers spend more than an hour a week SSH-ing for docker logs. Skip Loki if journald tailing suffices; defer Tempo or Jaeger until three or more services sit on critical paths.
Open source vs SaaS cost
- VPS hosting: roughly €10–25/month for an 8 GB instance versus €15–40 per host per month on entry Datadog or New Relic tiers
- Engineer time: one focused day to bootstrap Prometheus/Grafana; ongoing tuning one to two hours monthly for small teams
- SaaS wins when you need turnkey APM, ML anomaly detection, or twenty-four-seven vendor support without hiring platform skills
- Open source wins when you have one VPS, predictable metric cardinality, and a founder or senior dev who can read PromQL
- Hybrid works: self-host metrics, use free-tier synthetic uptime on public URLs
Tunis startups fund observability from the same envelope as hosting—not a separate enterprise line item. Prometheus metrics every SaaS should expose covers instrumentation that keeps cardinality under control.
What Tunis startups should prioritize
Teams in Tunis, Sousse, and Sfax often run five to fifteen people with one production VPS—the CTO may be on-call via WhatsApp. Dashboards must be obvious without a week of training: one Grafana folder per product, Telegram alerts where email is ignored. EU-hosted OVH instances keep observability data co-located with the app, which simplifies B2B DPA conversations. Startup Act graduates trade cash for founder maintenance time; if nobody will tune scrape configs after the first hire leaves, SaaS is the rational buy.
Common mistakes
- Installing every exporter before defining three user-facing SLOs
- Alerting on CPU above seventy percent with no sustained duration—noise kills trust
- Unbounded metric labels like user_id on every request—cardinality explodes TSDB size
- Grafana open to the internet without SSO or strong admin password rotation
- No backup of Grafana dashboards and Prometheus rules in git
- Buying SaaS APM before you have HTTP metrics from your own app
How DarDev helps
DarDev deploys Prometheus, Grafana, and guarded alert routes on client clusters and our mailer stack—see dardev.net/products under Logs, metrics and alerting.
Can Prometheus and Grafana share one VPS with my Node or Python API?
Yes for early traffic if you size RAM for both app and TSDB growth. Move observability to a dedicated instance when p95 latency correlates with Prometheus compaction or you need isolation for compliance.
How does self-hosted cost compare to Datadog for five hosts?
Five hosts on entry SaaS tiers often land at €75–200/month plus overages. An 8 GB VPS near €20/month plus engineer setup time is usually cheaper through Series A scale if cardinality stays disciplined.
Do I need Loki on day one?
No. Start with metrics and structured stdout logs you can tail. Add Loki when cross-service log search blocks debugging weekly.
What should a Tunis two-person tech team alert on first?
Scrape target down, HTTP 5xx rate above a five-minute baseline, and disk eighty-five percent full. Expand after those prove actionable.
Where does DarDev run this stack?
On dardev-vps and client Kubernetes clusters we operate—Prometheus, Grafana, deploy annotations, and runbooks tied to real pipelines described on dardev.net/products.