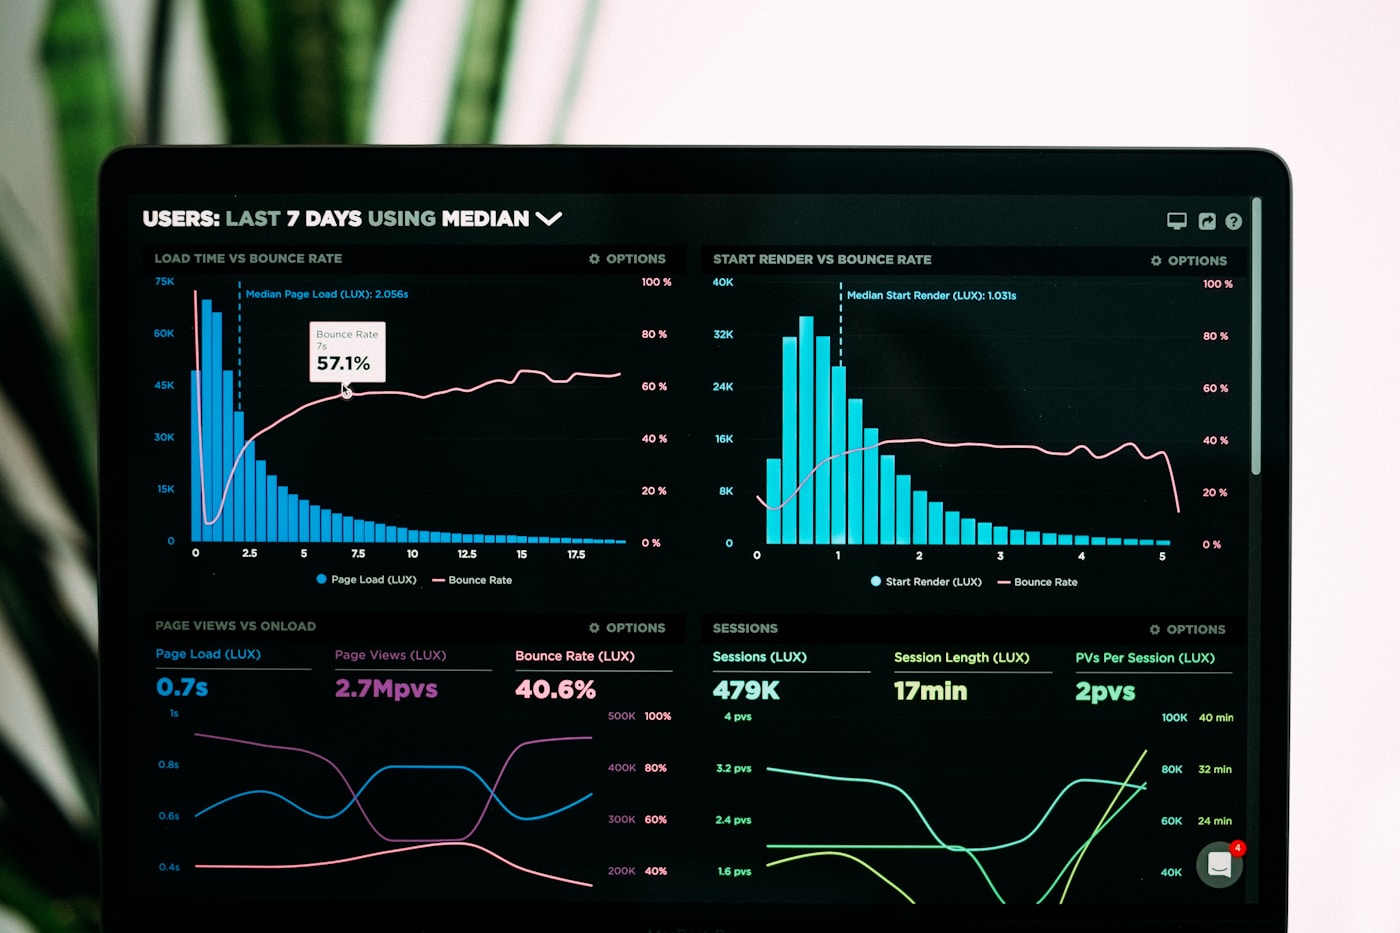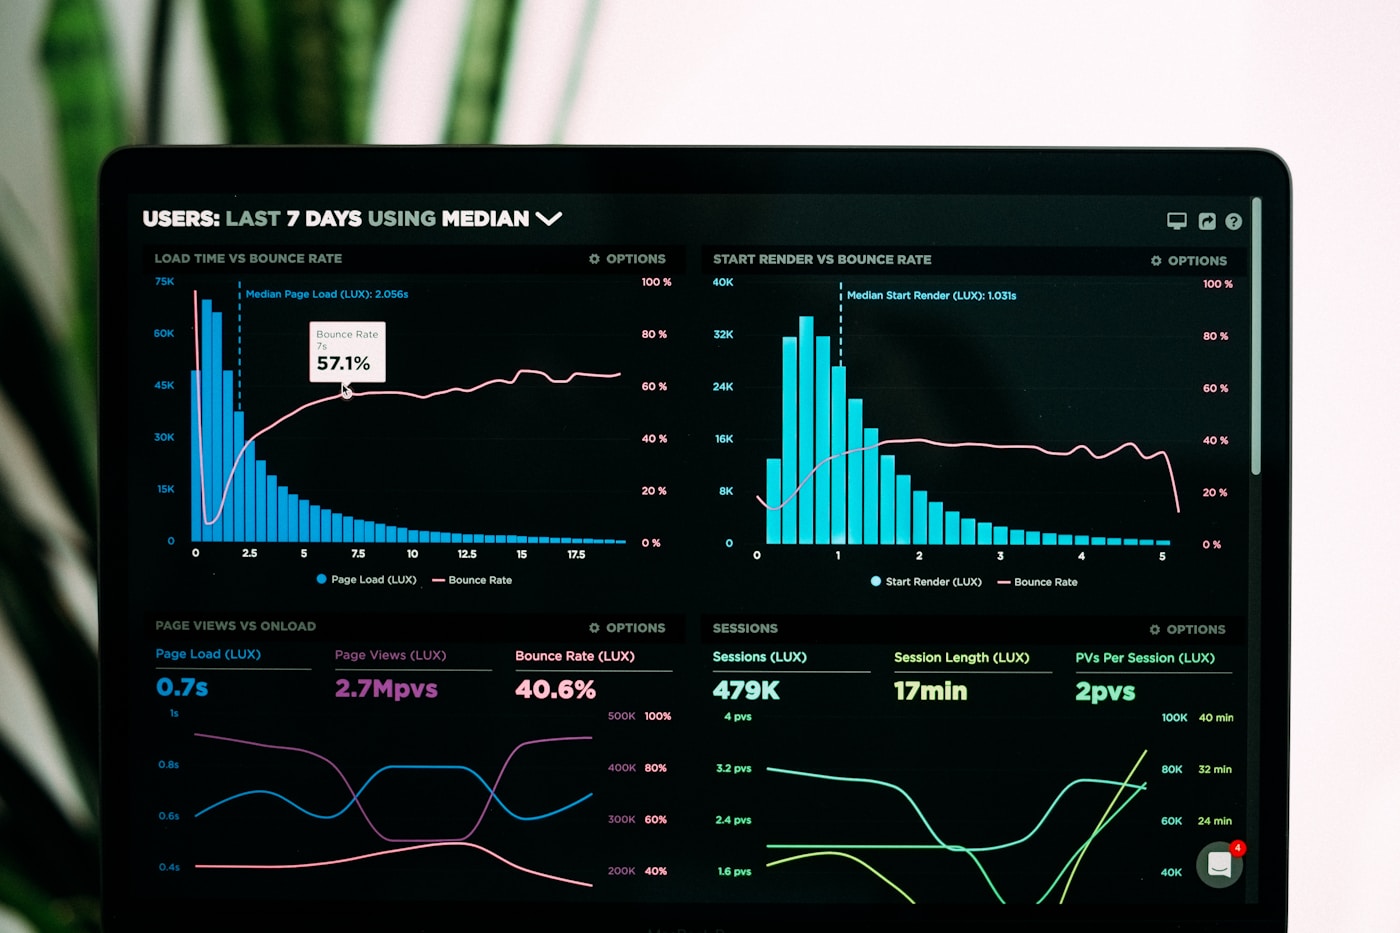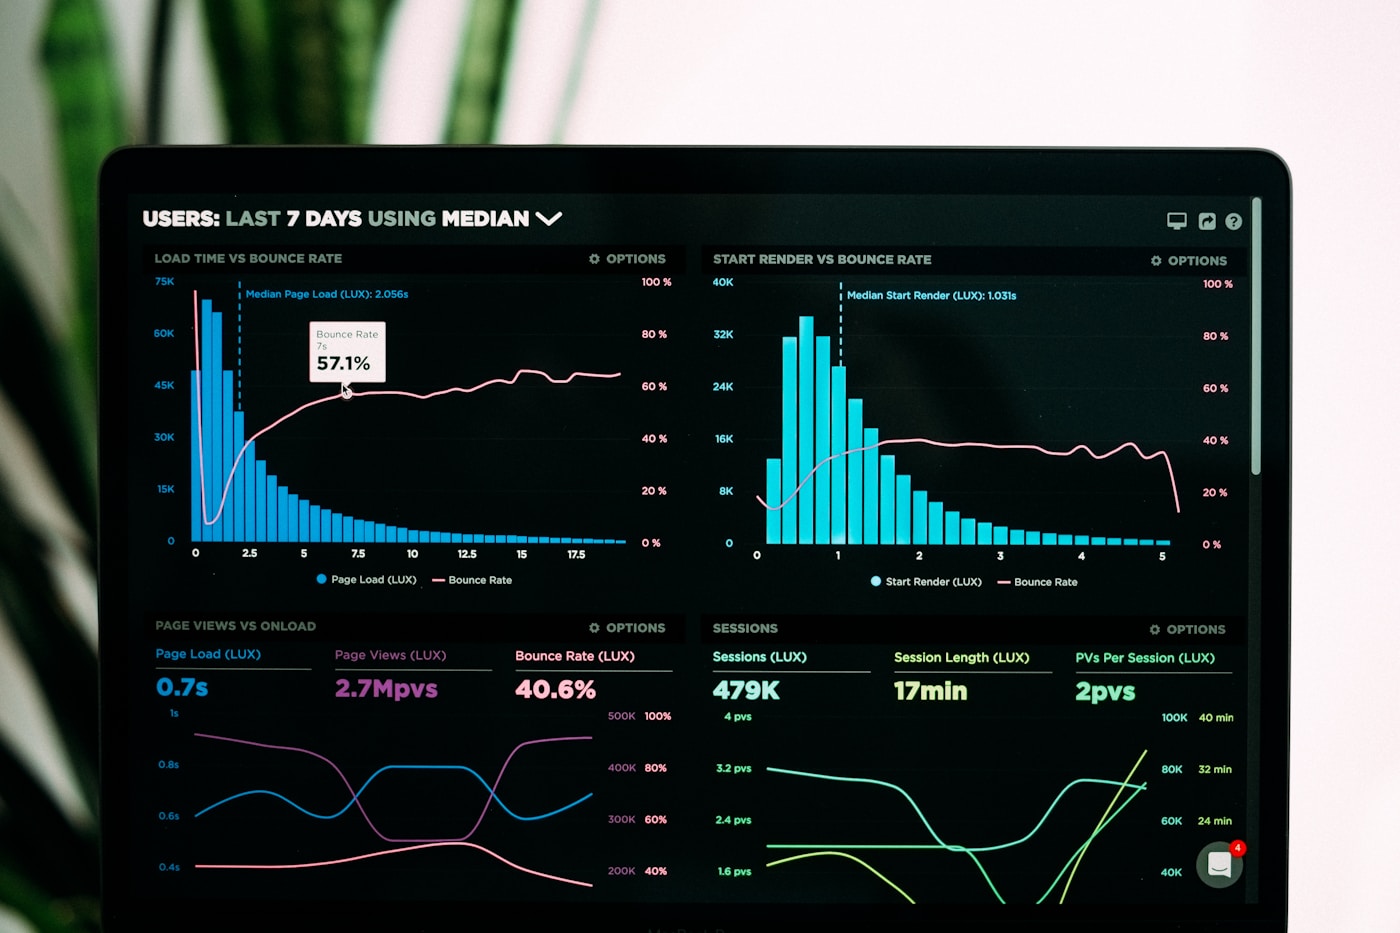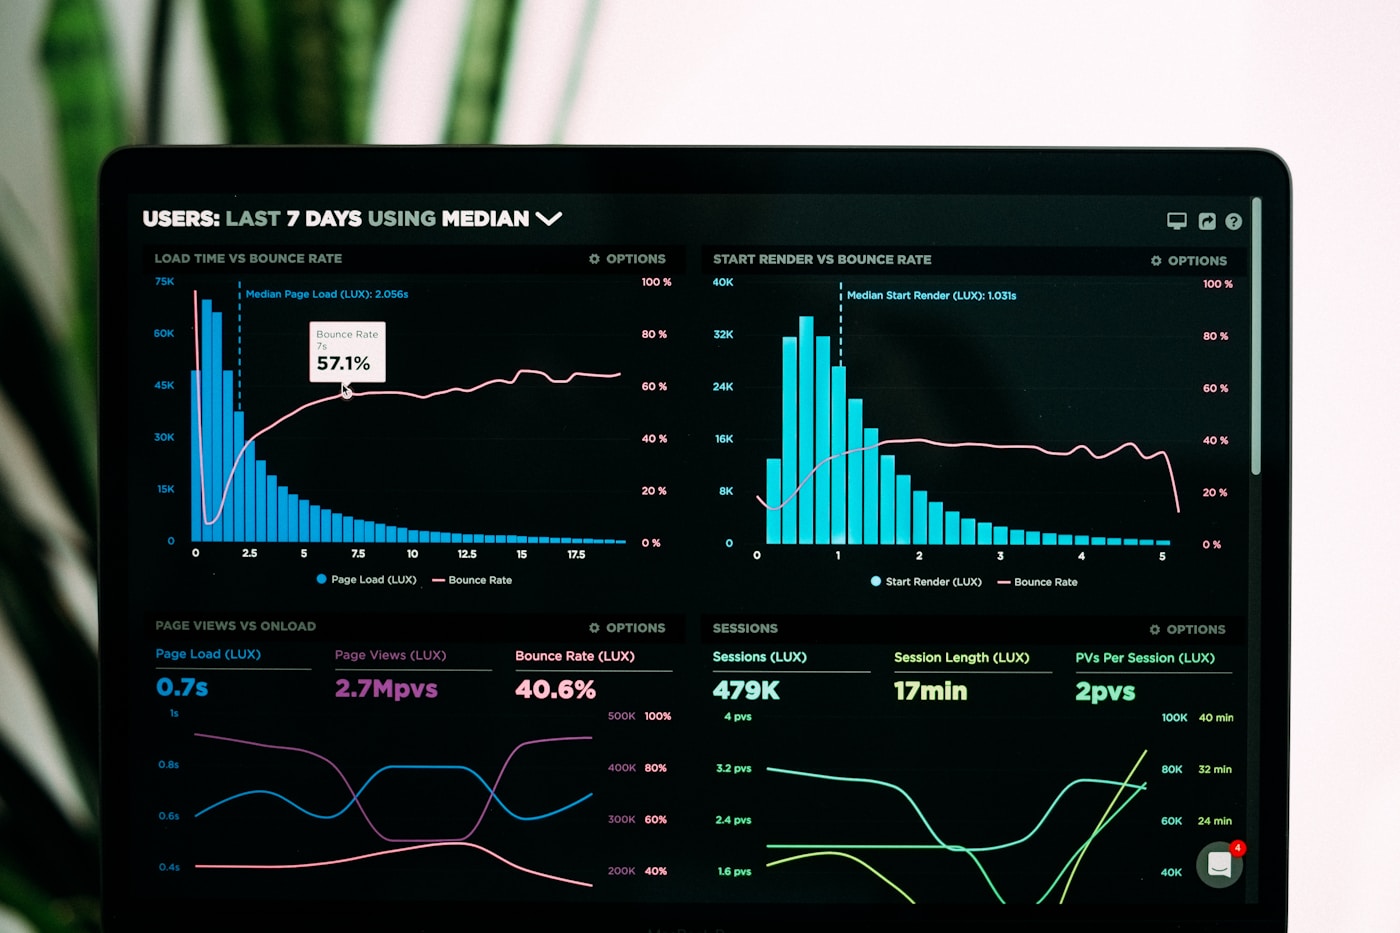
Use metrics when you need to know that something is wrong right now—error rate spiked, disk is filling, queue depth doubled. Use logs when you need the story behind one failed request: which user, which SQL statement, which upstream timeout. Use traces when a single user action crosses three services and nobody can agree which hop added four seconds. Most Tunis SME teams should start with Prometheus metrics and Grafana dashboards, add Loki for logs when grep across containers becomes weekly pain, and defer Jaeger until microservice boundaries actually obscure latency.
DarDev runs production stacks on dardev-vps and client Kubernetes with the same phased approach. This guide maps the three pillars to golden signals, budget constraints on a single OVH VPS, and the upgrade triggers we use before recommending another datastore.
Metrics: your first line of defense
Metrics are numeric time series: counters, gauges, histograms scraped every fifteen to sixty seconds. They are cheap to store relative to raw logs, cheap to alert on, and ideal for the four golden signals—latency, traffic, errors, saturation. A two-person platform team can run node_exporter plus one application /metrics endpoint and answer most on-call questions without opening a log file.
- Alert on symptoms users feel: HTTP 5xx rate, p95 latency, disk free percent
- Keep label cardinality low—never put customer email in a Prometheus label
- Pair metrics with deploy annotations so spikes correlate to releases
- Export RED panels first; see grafana-dashboards-small-teams for layout we reuse
If you only have budget for one observability skill this quarter, instrument metrics and write three PromQL alert rules. promql-deploy-health shows queries we attach to GitLab deploy gates. Metrics fail when you need verbatim error messages or multi-line stack traces—that is when logs earn their disk.
Logs: context when metrics spike
Logs are immutable event records—often JSON lines with timestamp, level, message, request_id. They answer why after metrics answer what. SSHing into a VPS and tailing docker logs works until you have four containers, two environments, and an incident at 2 a.m. when nobody remembers which host ran the worker.
Structured logging is the prerequisite: parseable fields beat prose paragraphs. Standardize request_id across API, worker, and edge proxy so one ID grep reconstructs a path. Log at INFO for business events, WARN for recoverable faults, ERROR for user-visible failure—DEBUG only in staging or behind a feature flag to avoid drowning storage.
Traces: follow latency across services
Distributed traces stitch spans—timed operations with parent-child links—into a waterfall for one trace_id. They shine when a checkout request hits API, payment service, inventory worker, and email sender, and p95 latency doubled but each service logs look fine in isolation. Traces are the most expensive pillar: instrumentation code, collector overhead, and Jaeger or Tempo storage.
Monolith on one VPS rarely needs traces on day one. Add tracing when you have three plus independently deployable services sharing user-facing latency SLO, or when logs with request_id still cannot pinpoint which downstream gRPC call stalled. Start with head-based sampling at one to five percent in production; raise temporarily during incidents.
Golden signals map cleanly to pillars
- Latency — histogram metrics for p50 and p95; traces for tail latency across hops
- Traffic — request rate counters from nginx and app exporters
- Errors — 5xx ratio metrics; logs for exception type and stack
- Saturation — CPU, memory, connection pool gauges; logs for pool exhaustion messages
Dashboards explore; alerts page humans. Do not duplicate every metric as a log line—that doubles noise. Do log the error detail when a counter increments.
When to add Loki
Add Grafana Loki when post-incident review routinely spends thirty plus minutes grepping across hosts, when compliance asks for searchable audit history, or when metrics show elevated errors but teams cannot find matching log lines within five minutes. Loki indexes labels—not full text—so label discipline matters as much as Prometheus: service, environment, level, not unbounded user_id.
- Ship structured JSON logs
Stdout from containers; one schema documented in README.
- Deploy Promtail or Alloy
Scrape docker logs or files; forward to Loki with consistent labels.
- Link Grafana Explore
Jump from Prometheus graph spike to LogQL filter on same request_id.
- Set retention and limits
Cap ingestion rate; alert on Loki disk usage like any other datastore.
observability-on-a-budget walks the open-source stack costs on a single VPS—Loki plus Prometheus plus Grafana fits many Tunis startups before managed vendors.
When to add Jaeger or Tempo
Introduce Jaeger, Grafana Tempo, or vendor tracing when cross-service latency is a product complaint, when you are splitting a monolith into services and lose single-log grepability, or when SLO dashboards show tail latency growth without obvious error counters. OpenTelemetry collector receives spans from apps and exporters; avoid proprietary SDK lock-in when possible.
Tracing without metrics is disorienting—you see slow spans but no fleet-wide error budget. Tracing without logs is incomplete—spans show which service waited; logs show the database deadlock text. Run all three eventually on mature platforms; sequence matters for teams with one ops day per week.
Tunisia VPS budget reality
A typical OVH VPS in Tunis hosting app, Postgres, Prometheus, and Grafana might have eight vCPU, sixteen GB RAM, and eighty GB SSD shared across everything. Prometheus with fourteen-day retention and moderate scrape count can consume two to four GB RAM; Loki adds another one to three GB depending on log volume; Jaeger all-in-one adds one to two GB when tracing is enabled. Adding all pillars on day one without limits is how teams OOM the host during a traffic spike.
- Phase 1 — metrics plus alerts plus one dashboard (week one)
- Phase 2 — Loki with retention cap when grep pain is weekly (month two to three)
- Phase 3 — sampled traces when microservices ship (quarter two)
- Keep heavy analytics off peak hours if CPU credits matter on smaller instances
Power and connectivity blips happen—design alert delivery through mobile Telegram or SMS, not only email that depends on the same SMTP you are debugging. prometheus-metrics-every-saas lists minimum counters every SaaS API should export before debating log vendors.
Anti-patterns we remove from client installs
- Logging every health check at INFO—noise hides real errors
- Buying APM before /metrics exists
- Full trace sampling in production on memory-constrained VPS
- Logs without request_id correlation across services
- Dashboards with no link to runbook-rollback-bad-deploy when error rate fires
How DarDev helps
DarDev Services observability engagements start metrics-first: scrape targets, alert rules, and one Grafana board tied to your deploy pipeline. We add Loki or OpenTelemetry when your architecture justifies the RAM line item—not because a vendor slide said three pillars day one. Request a scoped assessment at dardev.net/products.
Tomorrow: confirm your app exports http_requests_total and http_request_duration_seconds. Next week: pick one alert on 5xx rate. Add Loki when you have structured logs and a retention number written down. Traces can wait until metrics and logs already shorten your last three incidents.
Can we skip metrics and start with logs?
Not recommended. Logs without aggregate counters force manual counting during outages. Export basic RED metrics first, then centralize logs.
Loki vs Elasticsearch for a small team?
Loki pairs with Grafana and label-first indexing—lower ops burden on one VPS. Elasticsearch wins when full-text analytics across huge corpora is the primary use case.
How much trace sampling is enough?
One to five percent for steady state; temporarily increase to twenty five percent when debugging tail latency. Full sampling is for staging only on budget hardware.
Do we need traces for a monolith?
Usually no until latency complaints reference multiple internal subsystems with separate connection pools. Request_id in structured logs covers most monolith debugging.
DarDev setup help?
Observability solution via DarDev Services—phased Prometheus, Loki, and optional Tempo with runbooks sized to your VPS.