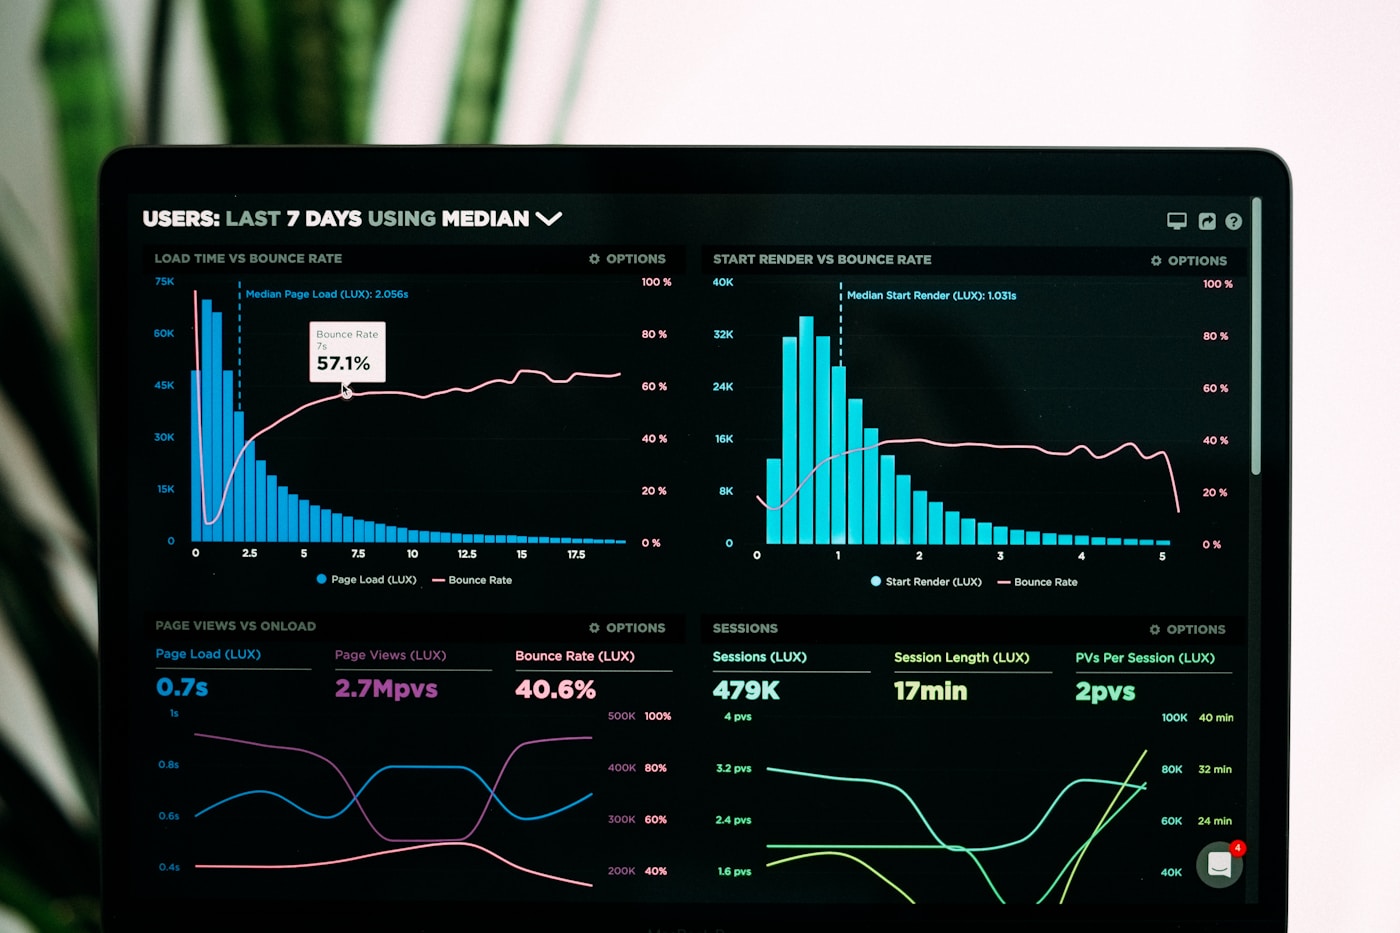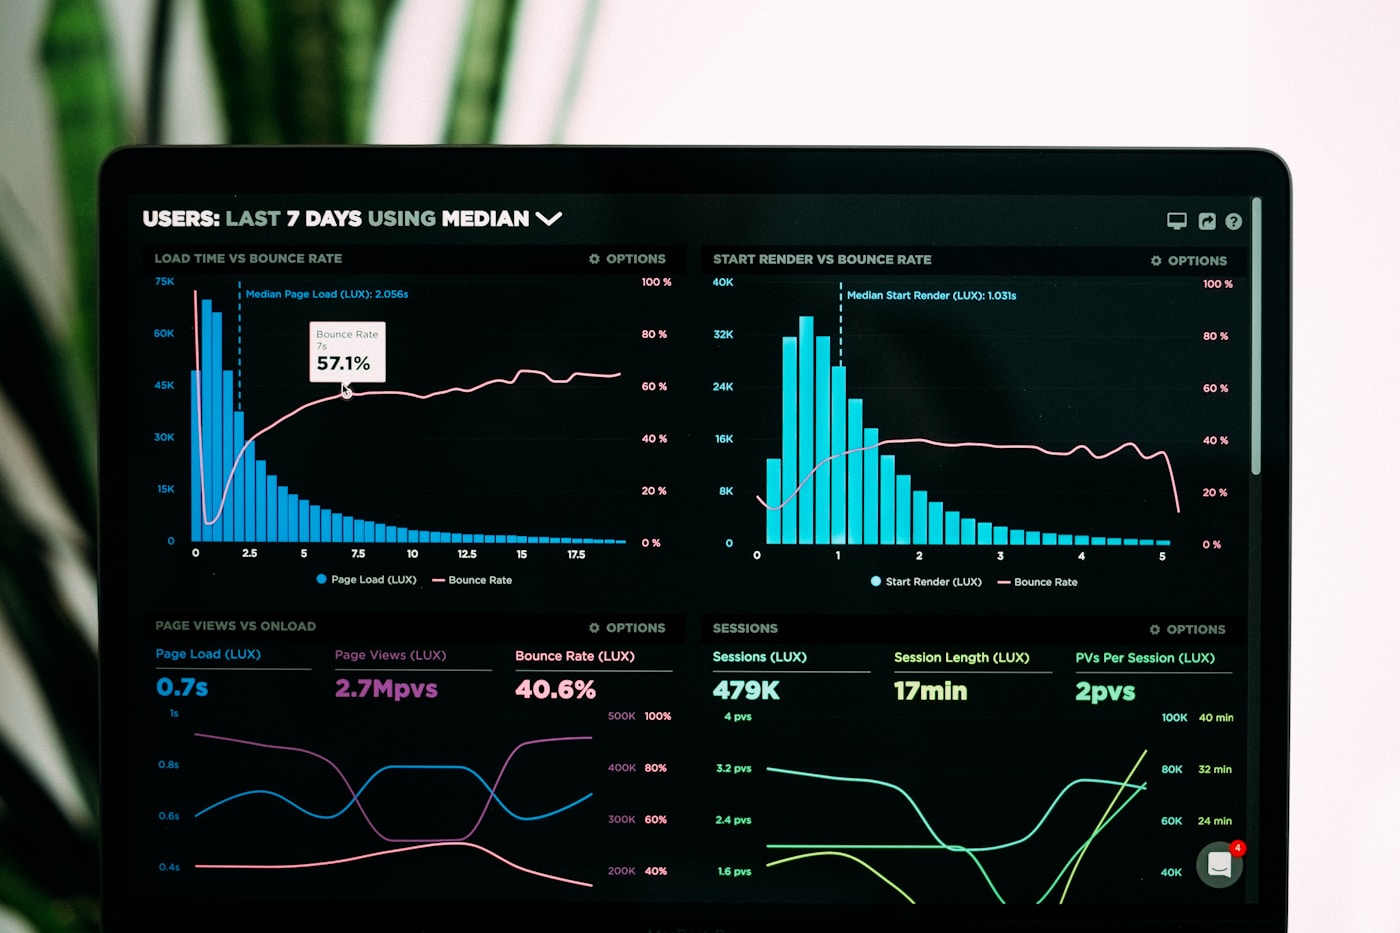
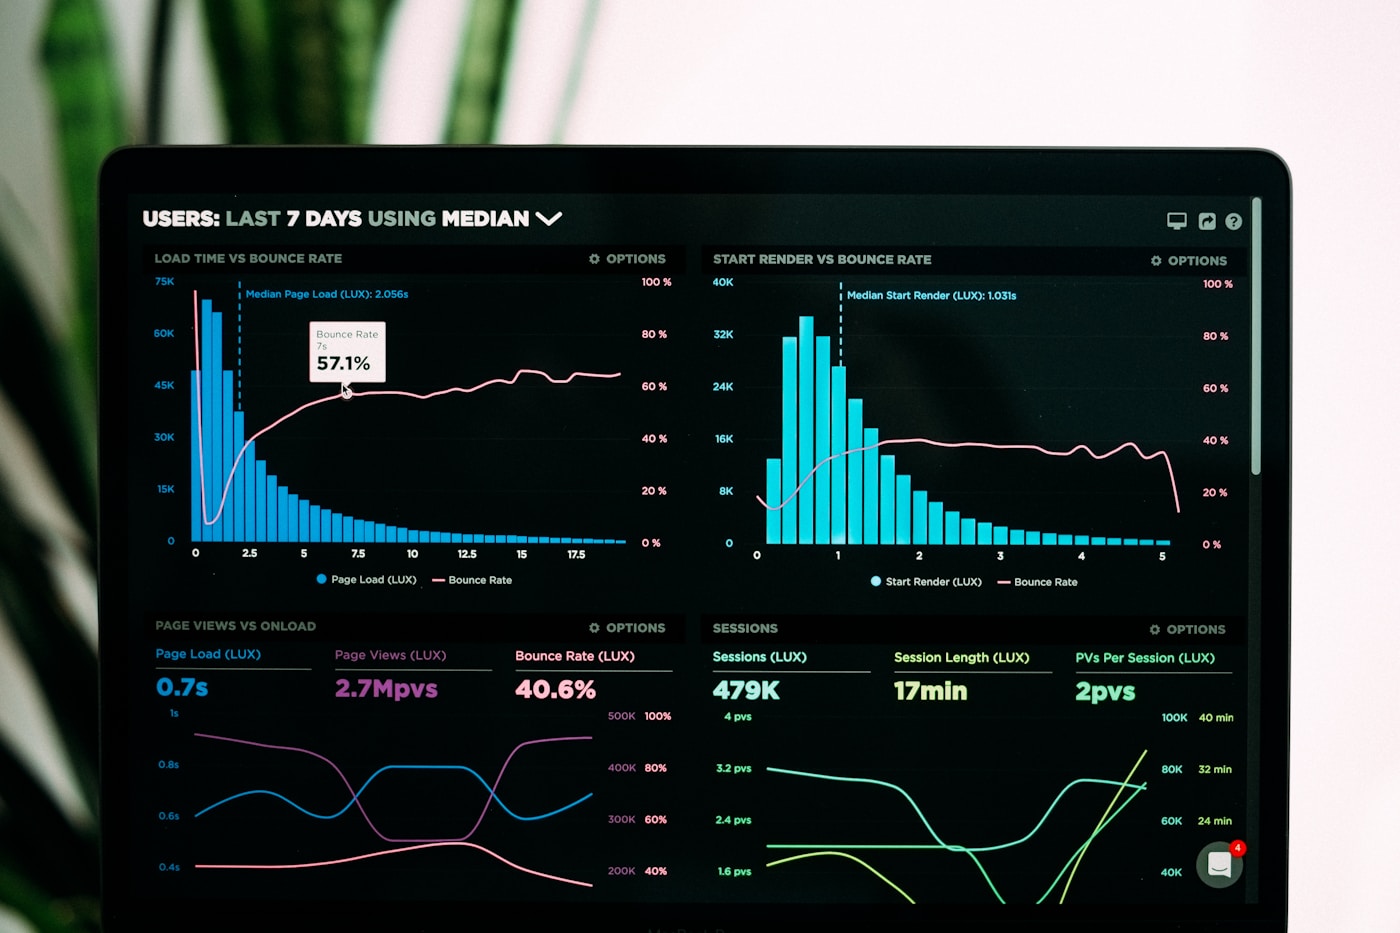
Small platform teams in Tunis—two developers who also answer support tickets—do not need Grafana dashboards cloned from Netflix blog posts. They need five panels that tell you to roll back, scale, or fix Postgres before customers notice.
DarDev builds observability for dardev-vps and client Kubernetes with Prometheus plus Grafana. This guide is what we actually deploy, not every plugin in the catalog.
Start with questions dashboards must answer
- Is the app serving errors right now?
- Is CPU or memory saturation causing latency?
- Is Postgres connection pool exhausted?
- Did deploy change error rate in last fifteen minutes?
- Is disk about to fill on VPS?
If a panel does not map to an action, delete it. Dashboard clutter hides spikes.
Golden signals on a budget
Latency, traffic, errors, saturation—Google SRE framing works on single VPS. nginx or Traefik access logs feed request rate; app exports HTTP 5xx counter; node_exporter gives CPU, memory, disk.
Dashboard layout we reuse
- Row 1 — RED
Request rate, error rate, duration p95 for main service.
- Row 2 — Node
CPU, memory, disk percent with thresholds colored at 70 and 85.
- Row 3 — Data tier
Postgres connections active, replication lag if applicable.
- Row 4 — Deploy marker
Annotations from CI deploy timestamp—correlate spikes visually.
Label discipline
High-cardinality labels like user_id in Prometheus metrics explode memory—use aggregated counters. Standardize job, instance, service labels across exporters so one dashboard template works per client.
Alerts versus dashboards
Dashboards explore; alerts wake humans. Every alert needs runbook link—see runbook-rollback-bad-deploy. Page on symptom user-visible: error rate SLO burn, disk full in four hours—not CPU tick above fifty percent once.
Anti-patterns we remove from client installs
- Twenty panels nobody opened in ninety days
- Duplicate metrics with slightly different queries
- No timezone set—Tunis team reads UTC by mistake
- Dashboard-only monitoring with zero alert rules
Logs and traces later
Start metrics-first on VPS. Add Loki for logs when debugging needs correlation—logs-metrics-traces guide covers when to expand. Traces optional until microservices pain appears.
Export dashboard JSON to git for review—Flux can manage Grafana dashboards when teams mature; until then version control JSON in ops repo.
DarDevLab observability module assigns students to build this minimal board on lab cluster—not import ID 1860 from grafana.com blindly.
Review dashboards quarterly with on-call: which panel did we actually stare at during last incident?
VPS-specific gotchas in Tunisia
Single OVH VPS hosts app plus Prometheus plus Grafana—set memory limits on Prometheus container or it OOMs during scrape spike. Schedule heavy queries off peak if CPU credits matter on small instance.
Power and connectivity outages happen—alert delivery via SMS or mobile Telegram when SMTP also down.
Teaching stakeholders to read one graph
Product owners need one error-rate panel in meeting room TV—not full ops board. Align on green/yellow/red thresholds in writing to avoid subjective panic.
Post-incident review exports screenshot with deploy annotation—builds culture linking change to impact.
Free tier Grafana Cloud can backup dashboards while metrics stay self-hosted—hybrid acceptable for two-person team.
Metric naming convention
Prefix app metrics with service name: hesabi_api_http_requests_total not http_requests_total. Consistency lets you clone dashboard JSON between client projects with search-replace only on prefix.
Recording rules pre-aggregate expensive queries—five-minute error rate for alerting, raw for debug dashboard row hidden by default.
Staging dashboard duplicates prod with environment variable in title—prevents comparing apples to oranges during release rehearsal.
On-call rotation of two people means dashboards must explain themselves—assume viewer is founder who does not know PromQL.
Integrate deploy webhook annotation from GitLab pipeline ID—links Grafana to merge request in one click.
Start tomorrow with node_exporter plus one app /metrics endpoint—you can add Loki next sprint.
Avoid copying community dashboard 315 without removing panels your stack lacks—empty graphs erode trust during incidents.
Founders appreciate one weekly email with error budget summary—Grafana snapshot PDF automated Monday morning.
DarDev Services observability package includes this dashboard template customized to your scrape targets.
Validate alert fires in staging by injecting fault—dashboard without tested alert is wallpaper.
Mobile Grafana app useful for founder on-call—keep one dashboard phone-friendly with large stat panels.
Budget half day monthly to prune unused metrics—cardinality creep sneaks up on growing apps.
Link dashboard rows to runbook-rollback-bad-deploy anchors—click path from graph spike to action steps.
Small teams win when observability answers one question fast—not when it wins architecture awards.
Export JSON to git today—even a rough dashboard beats tribal knowledge in one engineer's laptop.
Tomorrow morning, create one stat panel for HTTP 5xx rate—that alone beats zero observability.
See logs-metrics-traces when you outgrow metrics-only debugging.
One good alert plus one good dashboard beats a full observability suite nobody maintains on a VPS.
Grafana Cloud or self-host?
Self-host on same VPS or small sidecar until cost or ops burden favors cloud—many TN startups start self-hosted.
Prometheus on Docker Compose?
Yes—single node_exporter plus app /metrics scrape job is valid starting point.
Uptime Kuma enough?
Good synthetic check; pair with metrics for root cause—not replacement.
Who builds dashboards?
Platform owner with product owner input on SLO— not intern without review.
DarDev setup help?
Observability solution via DarDev Services—scoped install plus runbook.