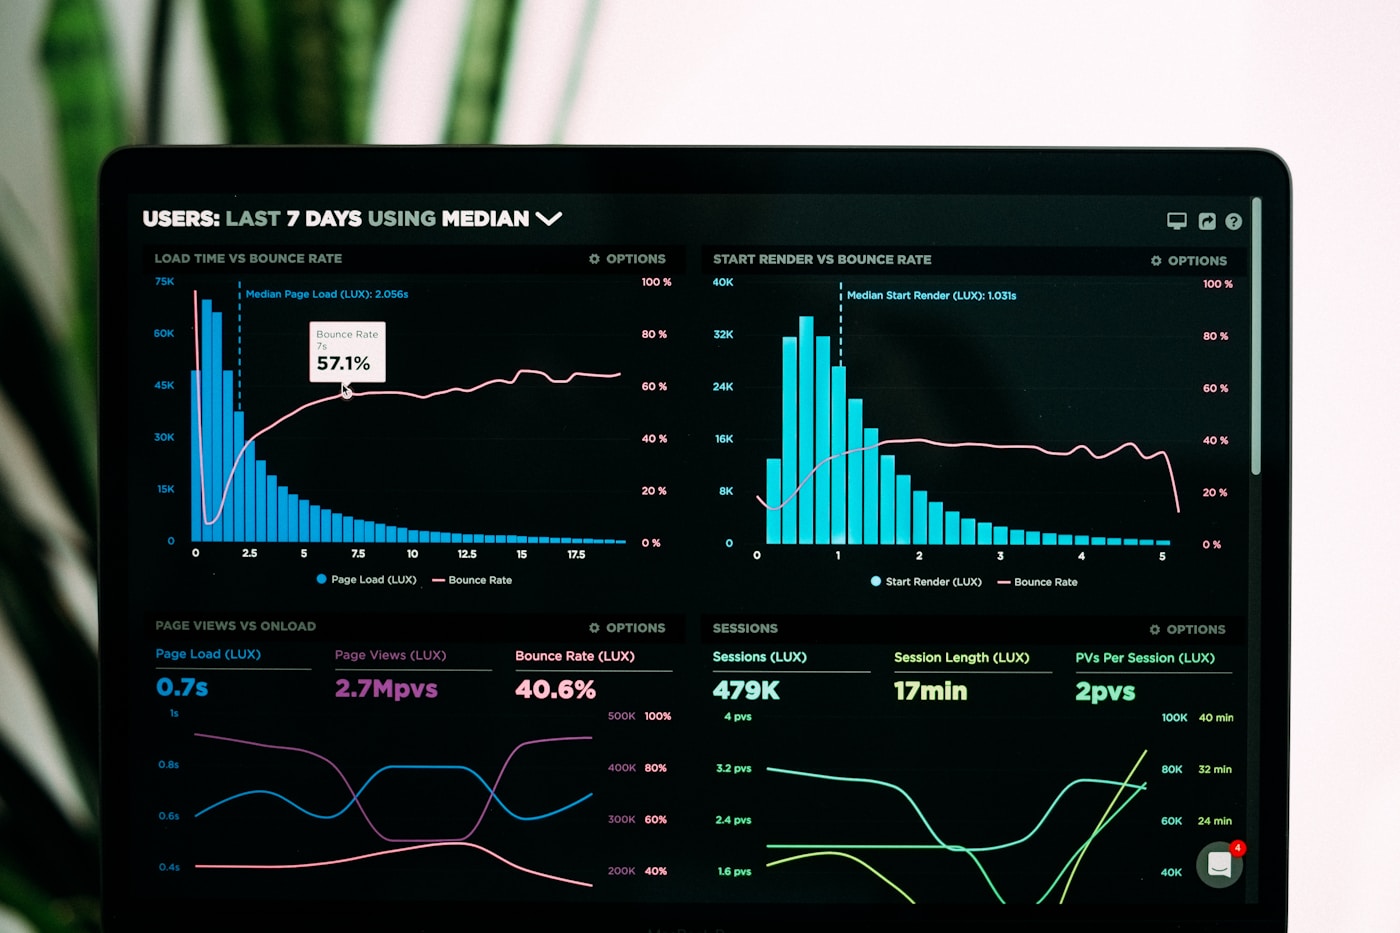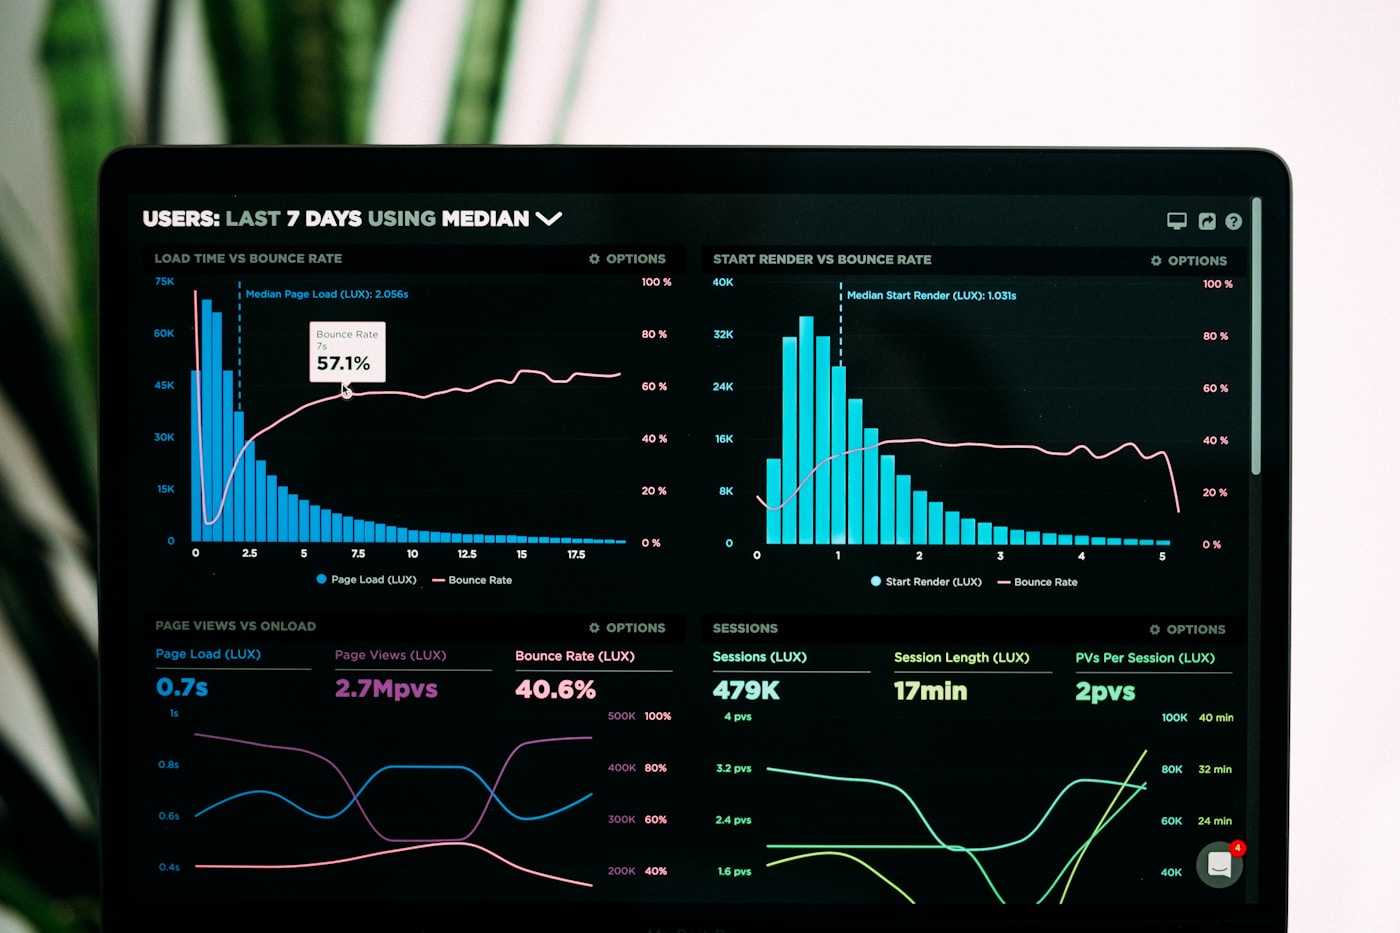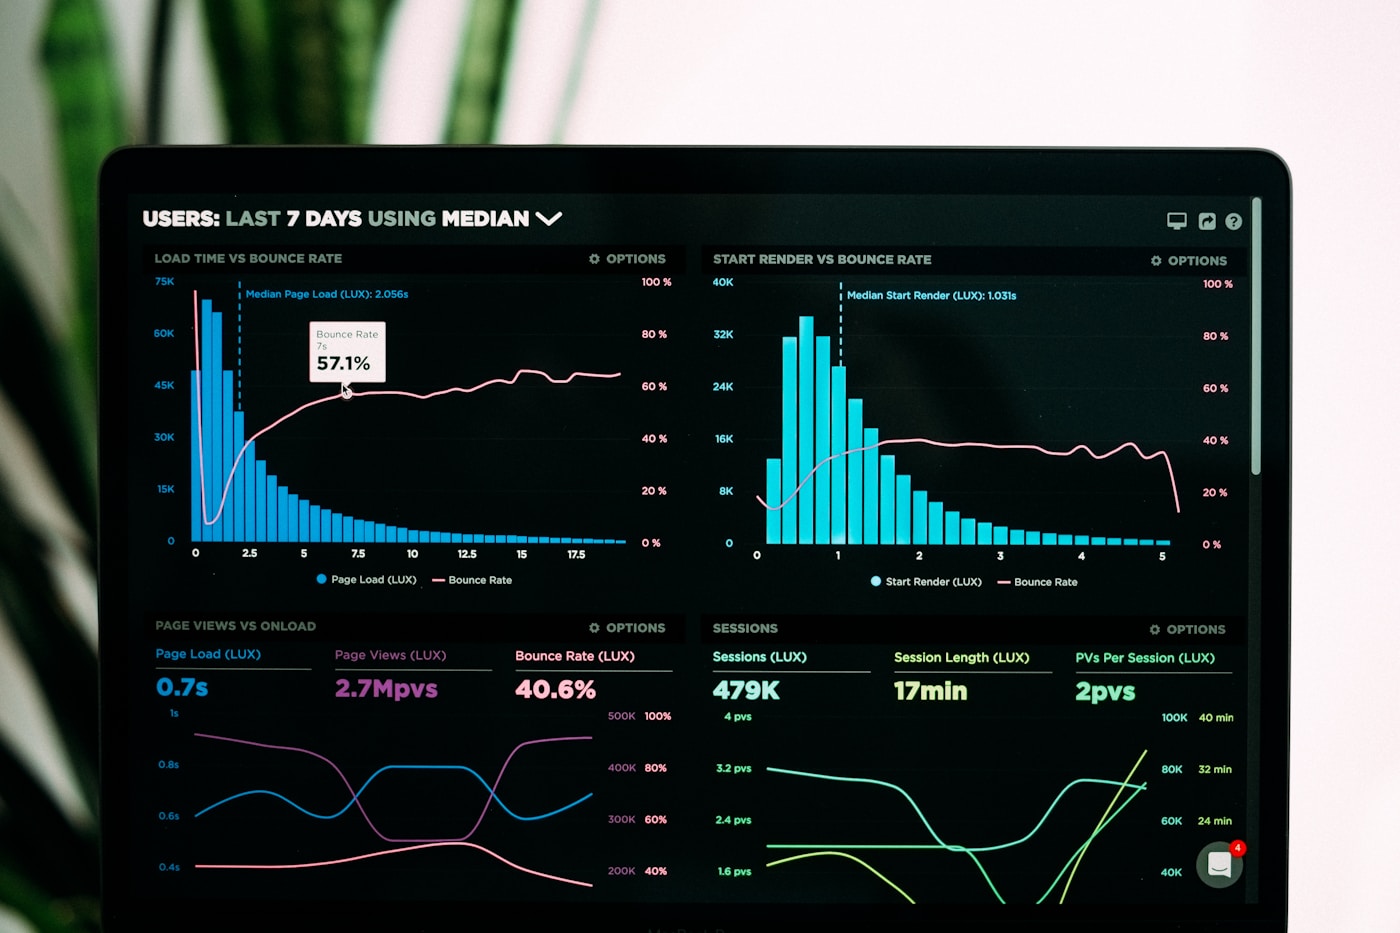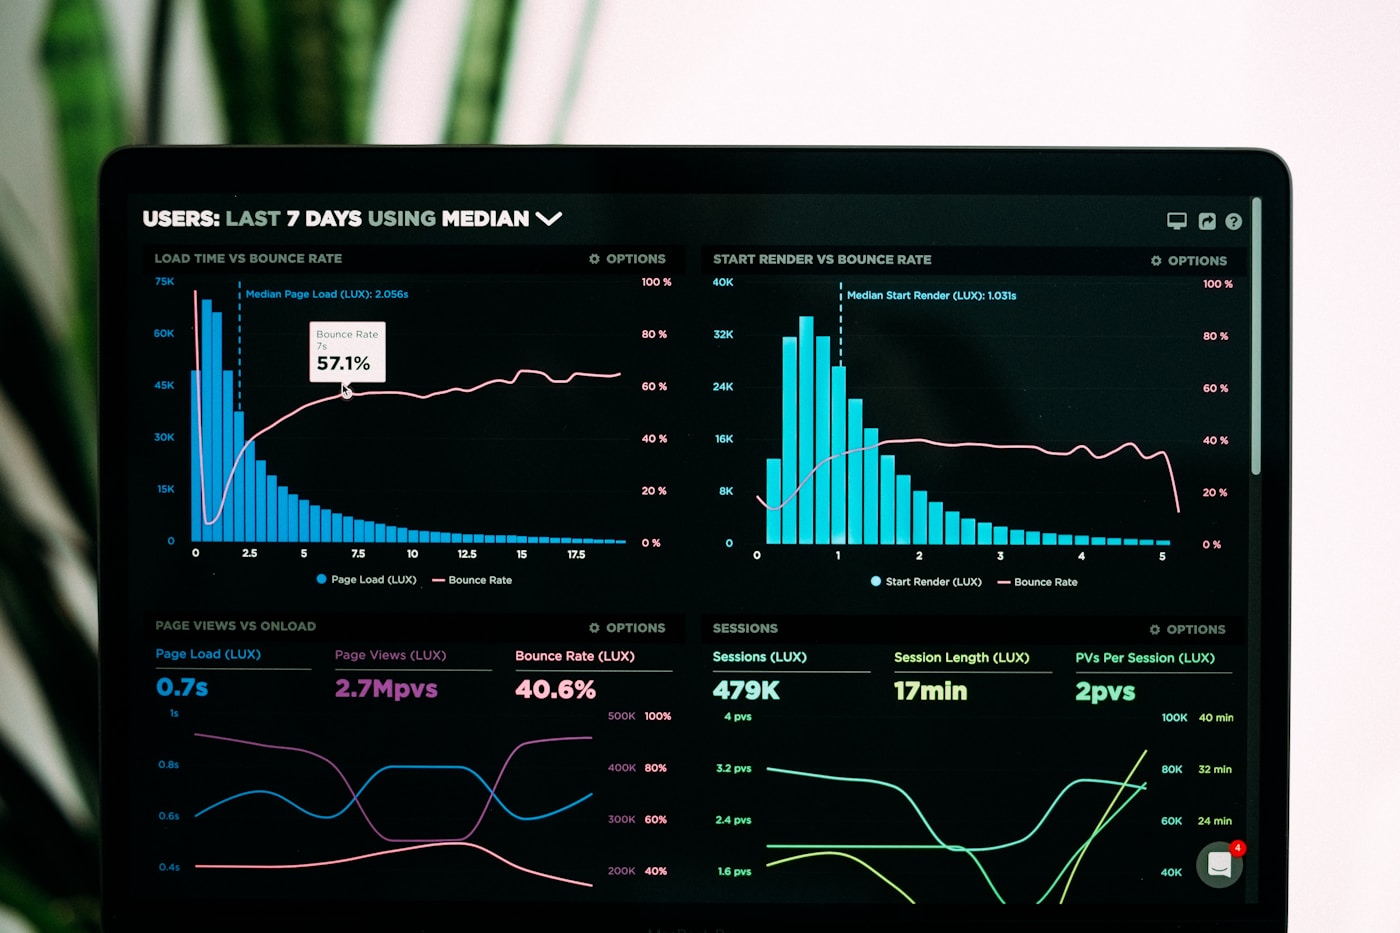
A service level objective (SLO) is a measurable reliability target your team agrees to hit—99.5% of API requests succeed within 500 ms, or the internal CRM search returns results within two seconds on nineteen of twenty business days. SLOs differ from SLAs (contractual penalties) and from aspirational uptime posters on the wall. They give you an error budget: the allowed amount of failure before you stop shipping features and fix reliability. Internal admin tools and customer-facing apps need different SLO tiers, different alert urgency, and often different SLIs—but the same Prometheus and Grafana stack can track both.
DarDev runs Twenty CRM, Listmonk, sync workers, and client SaaS on the same dardev-vps cluster. We set stricter burn-rate alerts on customer login and invoice APIs than on internal Grafana or Stalwart admin panels. This guide explains how to choose SLIs, write targets that survive on-call, and wire error budgets to deploy decisions without dashboard theater.
SLI, SLO, SLA: three letters that confuse every kickoff
The service level indicator (SLI) is what you measure—HTTP availability, p95 latency, job success rate, queue age. The SLO is the target over a window: 99.9% availability measured over thirty rolling days. The SLA is the legal wrapper with credits or penalties; many Tunis B2B contracts mention uptime without defining how it is measured. Start with SLIs your users actually feel, then pick SLO numbers your on-call can defend with PromQL, not numbers copied from AWS marketing pages.
- Availability SLI — ratio of good requests to total requests (exclude 4xx the client caused)
- Latency SLI — fraction of requests faster than a threshold (histogram quantile)
- Freshness SLI — max age of replicated data or sync lag for workers
- Correctness SLI — business outcome success (invoice cleared, email accepted by MTA)
If you lack a /metrics endpoint with RED counters, stop here and read prometheus-metrics-every-saas first. SLOs built on nginx logs alone are better than nothing, but histogram-backed latency SLIs need application instrumentation.
Internal tools vs customer apps: different stakes, different targets
Internal tools—CRM imports, mail admin, CI dashboards, Stalwart queue viewers—can tolerate brief outages during business hours if a workaround exists. Customer-facing checkout, login, TTN clearance callbacks, and mobile sync cannot. We use a simple tier model: Tier 1 customer paths get 99.9% availability SLO and page within fifteen minutes on budget burn; Tier 2 internal paths get 99.0% and ticket-only alerts during business hours; Tier 3 dev sandboxes have no SLO, only metrics for curiosity.
- Customer API and auth — Tier 1: tight latency plus availability, multi-window burn alerts
- Background workers affecting invoices or mail — Tier 1 for success rate, Tier 2 for admin UI
- Internal Grafana, Portainer, CRM bulk import UI — Tier 2: weekly error budget review
- Staging and preview environments — Tier 3: metrics yes, paging no
Error budgets turn reliability into a product decision
An error budget is one minus the SLO target over the window. At 99.9% over thirty days, you can afford roughly forty-three minutes of bad events before the budget is exhausted. When budget remains, ship features and run canary deploys. When budget burns fast, freeze risky releases, extend soak time, and pull engineers off roadmap work. This is how SLOs connect to promql-deploy-health gates: a deploy that consumes five percent of the monthly budget in one hour should roll back automatically or block the pipeline.
Multi-window burn-rate alerting catches both sudden incidents (five-minute window) and slow leaks (six-hour window). Google SRE practice popularized this pattern; Grafana SLO dashboards and open-source recording rules implement it on self-hosted Prometheus without a vendor tax. Keep at least two windows—fast burn pages on-call, slow burn opens a ticket before customers notice trend drift.
Implementing SLOs on Prometheus and Grafana
- Pick one user journey per service
Example: POST /api/invoices succeeds in under 800 ms. Document excluded paths (health checks, bot traffic).
- Define SLI recording rules
PromQL ratio: sum(rate(http_requests_total{status!~"5.."}[5m])) / sum(rate(http_requests_total[5m])). Store in a recording rule for dashboard reuse.
- Set SLO target and window
Start conservative—99.5% for a new customer API beats a fantasy 99.99% nobody monitors. Use thirty-day rolling windows.
- Wire burn-rate alerts
Alert when budget consumption exceeds 2% in one hour or 5% in six hours (tune to your team size). Link alert runbook to rollback steps.
- Review in a weekly fifteen-minute ritual
Product plus platform: budget remaining, last deploy correlation, one action item. No slide decks.
Latency SLOs need histogram buckets aligned to your threshold—do not use averages. logs-metrics-traces explains when to add Loki for post-SLO incident narrative after metrics fire. Traces help when latency SLO breaches but availability SLI still looks green because errors hide in tail latency.
Common mistakes on small platform teams
- SLO on CPU usage instead of user-visible requests
- Identical targets for internal CSV export and customer login
- Alerting on every blip instead of budget burn
- No deploy annotation—cannot tie budget loss to a release
- Publishing SLA numbers in sales decks without matching SLI definitions
How DarDev helps
DarDev Services observability engagements include SLO design workshops: we map your critical user journeys, draft PromQL SLIs against existing metrics, and configure Grafana burn-rate alerts sized to your on-call rotation—not a fifty-panel PDF. Request a scoped assessment at dardev.net/products. We label beta and waitlist products explicitly; reliability targets apply only to production paths we operate.
This week: list three customer actions that would generate support tickets if they failed for ten minutes. Pick one, write a ninety-nine-point-five percent thirty-day SLO, and add a single burn-rate alert. Internal tools can wait until customer SLOs appear in your weekly review.
What SLO should a new customer API start with?
99.5% availability over thirty days plus a latency SLI on your busiest POST endpoint. Tighten after two months of clean budget history—not on launch day.
Do internal tools need SLOs at all?
Yes, but looser targets and business-hours alerting. They still benefit from error budgets when imports or admin panels break during month-end close.
How is this different from uptime monitoring?
Synthetic uptime checks one probe path. SLOs aggregate real user traffic, support burn rates, and connect to deploy policy. Use both—checks for reachability, SLOs for experience.
Can we run SLOs on a single Tunisia VPS?
Prometheus recording rules and Grafana SLO panels run fine on hesabi-scale hardware. Cardinality discipline matters more than server count—keep labels bounded.
DarDev setup help?
Observability solution via DarDev Services—SLO definitions, PromQL recording rules, and runbooks linked to your GitLab deploy pipeline.